

South Africa has the money. Nigeria has the people.
The rand float is bigger. The naira float is faster. Neither has crossed into real retail adoption. Let the wars begin.

In May I wrote that cNGN grew from ₦105 million to ₦2 billion in a year. A week later, while building the non-USD stablecoin scoreboard, I noticed the thing I had missed: South Africa’s rand stablecoins were quietly sitting on several times the supply of Nigeria’s naira ones.
That bothered me because I should have seen it earlier. I write about African stablecoins. I know the Nigeria story. I know the South Africa story. But my own coverage had followed the louder network, not the larger float.
So I re-ran the queries this week.
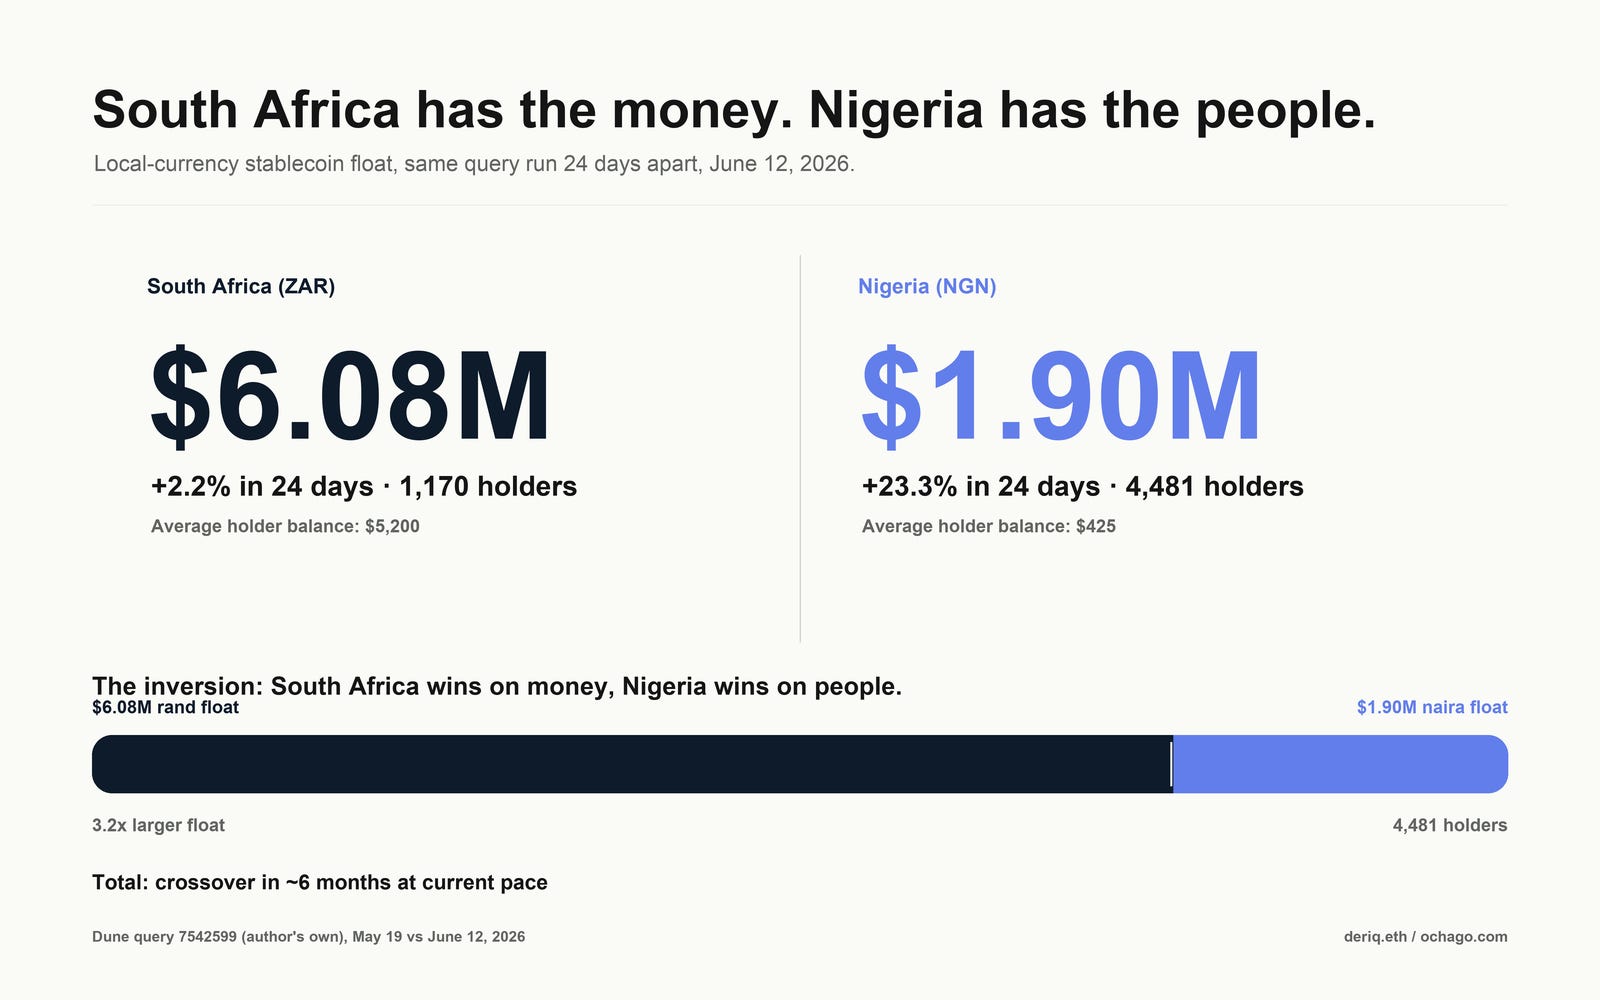
The data gave me the old exchange-operator split in a new wrapper: South Africa has the money. Nigeria has the people. But the deeper story is that neither side has the full market yet.
The gap is real
As of June 12, every ZAR stablecoin combined holds about $6.08 million across 6 chains. Every NGN stablecoin holds about $1.90 million (my Dune query, re-run June 12). South Africa’s rand float is 3.2 times Nigeria’s naira float.
Most of that rand supply is ZARP, around $4.5 million by itself (CoinGecko), which makes it roughly two and a half times cNGN alone. And here’s the uncomfortable part: I know Simon Dingle. I know ZARP, live since 2019, reserves managed by Old Mutual Wealth (ZARP, BitKE), with real volume on Base, the chain I spent my Coinbase years growing. The miss is mine. cNGN has the consortium, the SEC story, the press cycle, my friends at Convexity in my feed and my DMs, so cNGN is what I wrote about. ZARP spent those same years shipping instead of campaigning, and it out-floated the token everyone I know talks about. Proximity is an algorithm too. Mine had me covering the smaller float.
Coverage in this category tracks the narrative and the network, not the supply. That was going to be the whole piece. Then I looked at the deltas.
The gap is closing
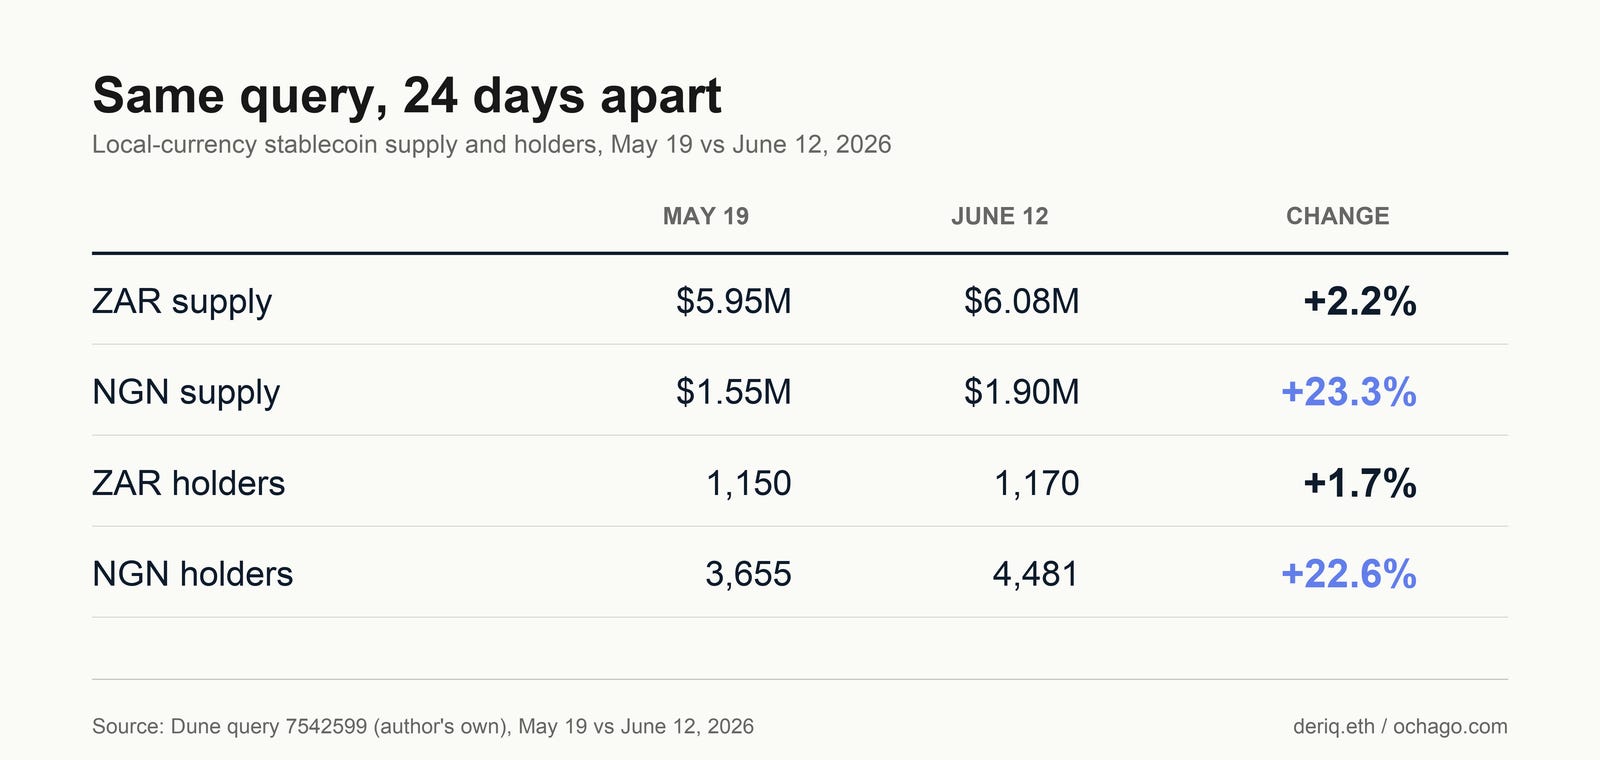
The rand float barely moved. The naira float grew 23 percent in under a month, and its holder count grew at the same pace. The weekly supply curve says the same thing in naira terms: ₦2.03 billion on May 19, ₦2.50 billion today, with Base’s share widening to 86 percent.
Run the arithmetic forward and it gets interesting. If both kept their current pace, the naira float would pass the rand float in about six months. That’s a projection of two noisy curves, not a prediction. But the direction is unambiguous: the quiet incumbent is static, the covered newcomer is compounding.
The holder mix tells you why these two floats feel so different. South Africa’s 1,170 holders average about $5,200 each. Nigeria’s 4,481 average about $425. One looks like a handful of treasuries and trading desks holding rand on-chain. The other looks like the front edge of a retail base.
I’ve seen this exact split before, from the inside. In my exchange days, every growth dashboard told the same story: the signups came from Nigeria, the volume came from South Africa. Nigeria filled the top of every funnel on the continent while South African accounts, fewer and fatter, moved the actual money. Now the local-stablecoin ledgers have reproduced that split almost exactly. Small wonder the same exchanges that built their growth teams in Lagos are out recruiting in Johannesburg these days. Signups fill a dashboard. Volume pays the bills. South Africa has the money. Nigeria has the people.
That line is easy to turn into banter because Lagos and Johannesburg have been arguing for a generation: economy, music, football, migration, whose companies make money where. Some weeks the argument is harmless. Some weeks it is not. This is one of the bad weeks; the repatriation flights out of Johannesburg began Thursday. But the stablecoin data is useful precisely because it cuts through the noise. It shows two markets that look opposed in narrative and complementary in structure.
Then the whale data complicates everything
In May I set a test for cNGN, and I wrote it down so I couldn’t wriggle out of it later: wallet count crossing 10,000 with whale share dropping below 85 percent means real adoption; wallet count growing while whale share stays pinned means “the treasury layer is carrying the entire chart by itself.”
I re-ran the holder distribution this week. Wallet count: 3,529 then, about 4,370 now, up 24 percent in under a month, on pace from the 832 of last August. The retail half of the test is passing.
The whale half failed. Whale share didn’t drop toward 85 percent. It went up: 92.3 percent to 93.8 percent, and the whale count went from 16 wallets to 20. Thirteen of them sit on Base holding 81.7 percent of everything.
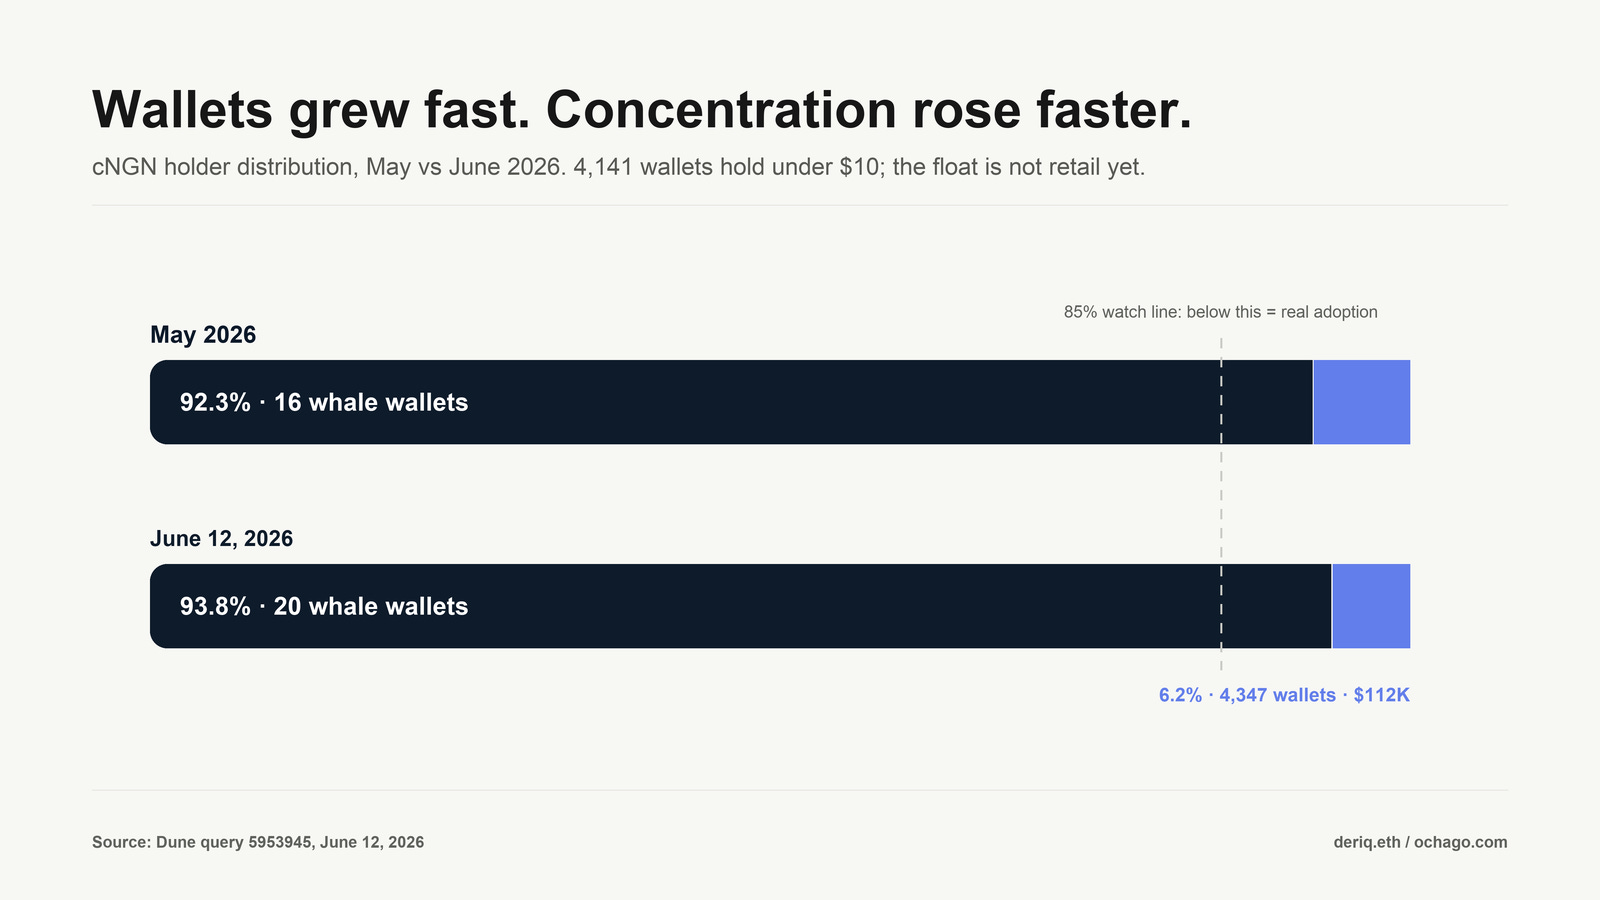
So the 23 percent monthly growth that’s closing the gap with South Africa is mostly treasury mints at the top, not the 4,100 small wallets at the bottom. Add up everything below the whale tier, the sharks, dolphins, crabs, and shrimps, and retail-sized holders own about 6 percent of cNGN’s float, roughly $112,000. The shrimp wallets I defended in May as real Nigerian retail, ₦5,000 to ₦15,000 each, are still arriving, faster than ever. They just don’t move the supply chart. Twenty wallets do.
Which means the honest version of this piece has three layers, and each one undercuts the last. South Africa’s rand float is bigger, but it’s sitting still. Nigeria’s naira float is compounding, but the compounding is whale-driven. And the retail adoption that would settle the argument, thousands of ordinary wallets holding local-currency stablecoins they actually use, hasn’t happened at scale in either country. Both floats together are under $8 million, in a continent where USDT on Tron moves billions. The local-stablecoin race is still two pilots arguing about pole position.
What I’m watching
Four things, with numbers attached.
First, the crossover. If NGN supply passes ZAR supply by year-end, the regulatory-first model will have beaten the distribution-first one on the only public scoreboard, and I’ll write that piece. If the naira curve flattens once the current mint cycle ends, May’s “treasury cycle” reading wins instead.
Second, whale share against my May line. It’s at 93.8 percent and moving the wrong way. The test stands: below 85 percent with wallets past 10,000 and cNGN’s story is on. The wallet half is on pace for early 2027. The whale half is the one to watch.
Third, whether ZARP wakes up. A new rand stablecoin, ZARU, launched in February with heavyweight backing, marketing itself as South Africa’s first despite ZARP’s seven-year head start. Nothing moves an incumbent like a funded challenger. If ZARP’s flat curve bends in the next quarter, that’s why.
Fourth, the one that would actually matter: a consumer integration. An Opay or PalmPay putting cNGN inside a 50-million-user app, or a South African bank putting ZARP or ZARU in front of retail. Either event makes every number in this piece look quaint. Neither has happened. The first one to land decides which country’s model gets written about as the one that worked.
I went looking for a winner between two African stablecoin models. The data handed me something more honest: a bigger float that doesn’t grow, a growing float that isn’t retail, and a market where the real competition, dollar stablecoins on cheap rails, is lapping both. And underneath the scoreboard sits the quiet structural fact the noise obscures: each float is shaped like the other’s missing half. Nigeria’s growth needs the balance-sheet depth South Africa already has. South Africa’s still treasuries need the crowd Nigeria already has. The first builder who treats Lagos and Johannesburg as one financial corridor wins the market both countries are failing to build alone. The story and the supply have come apart in this category. I’d rather keep reading the supply.
Disclosure: I don’t hold ZARP, cNGN, or ZARU, and haven’t in the past 12 months. Currency-level supply and holder figures are from my own Dune query (7542599), re-run June 12, 2026, against its May 19 run; cNGN weekly supply and holder tiers are from Dune queries 5950869 and 5953945 by intellisages_hq, re-run June 12. ZARP’s standalone figure is from CoinGecko, June 12. Holder counts are wallet addresses, which can overcount people and include dust. Transfer velocity for both tokens isn’t cleanly public at this size and is flagged as a gap, not estimated. One operator reading his own queries, not investment advice.